demo
An interactive, static view of a subset of the database--this might take a while to load.
abstract
The Solar Energy Innovation Laboratory (SOLEIL), under Professor David Fenning, manufactures and collects increasing amounts of perovskite solar cell data. SOLEIL varies chemicals, processes, and conditions for each cell to find the manufacturing process that produces optimal solar cells.
the problem
Because the data comes in many different and complex formats, it's hard to store, query, and analyze; detecting patterns in their data will allow the lab to make data-driven choices to improve their research, saving critical time and money.
Our project worked to create a database ("DB") that allows the lab to record data in a flexible and predictable manner, and easily query the data for analysis and visualization purposes.
project background
The SOLEIL lab aims to manufacture and test perovskite solar cells to improve them in different ways - lifespan, efficiency, and manufacturing consistency, to name a few.
Perovskite cell manufacturing data has intrinsic, complex relationships. Cell samples have differing chemical compositions, steps, and metrics. Solvents or precursors used in cells are from different manufacturing batches, and manufacturing steps themselves contain a differing number of sub-steps and chemicals.
The lab has an established manufacturing process and robust data collection, but lack a data storage and analysis procedure that allows for consistency, accessibility, and scaleup.
A successful, useful database solution involves consolidating:
- Individual, cell-level chemical compositions, linked to traceable batches of chemicals
- Detailed, cell-level manufacturing data (e.g. steps, completion time)
- Cell-level performance metrics, in a variety of data types (e.g. single integers vs. entire tables)
- Fast queries over a large scale of data for visualization and analysis purposes
- Data insertion, edits, and deletion are operations that are less frequent
- A modular structure that allows for future addition of new procedures, steps, or metrics
All of which ultimately allows the lab to organize their existing data, easily add new cells' data, and efficiently draw insights.
existing data pipeline
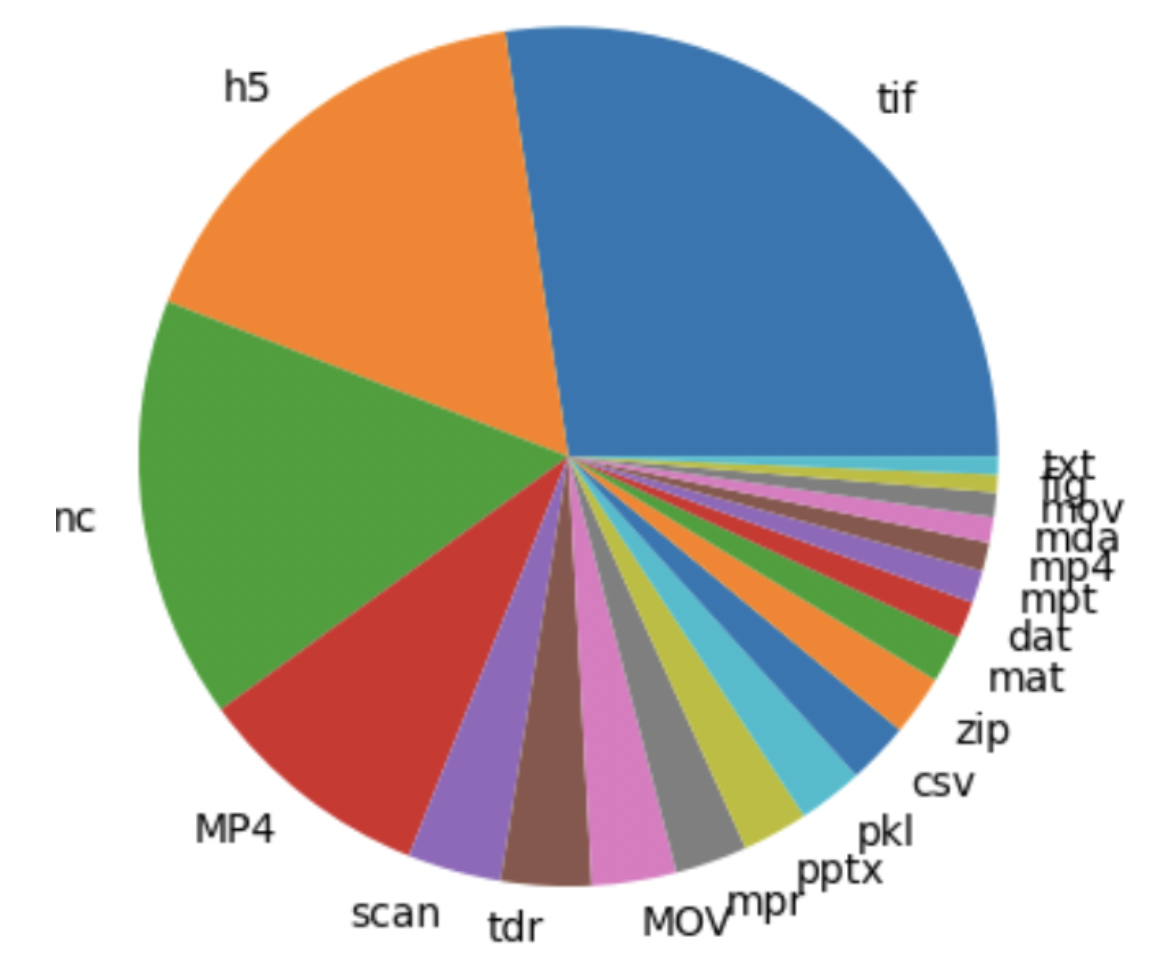
- Cell output data is spread across different folders, files, and data types (Figure 1). Output structure and naming conventions also vary between lab members
- The lab’s machine, PASCAL, uploads data to a Google Drive folder in a partially unregulated manner
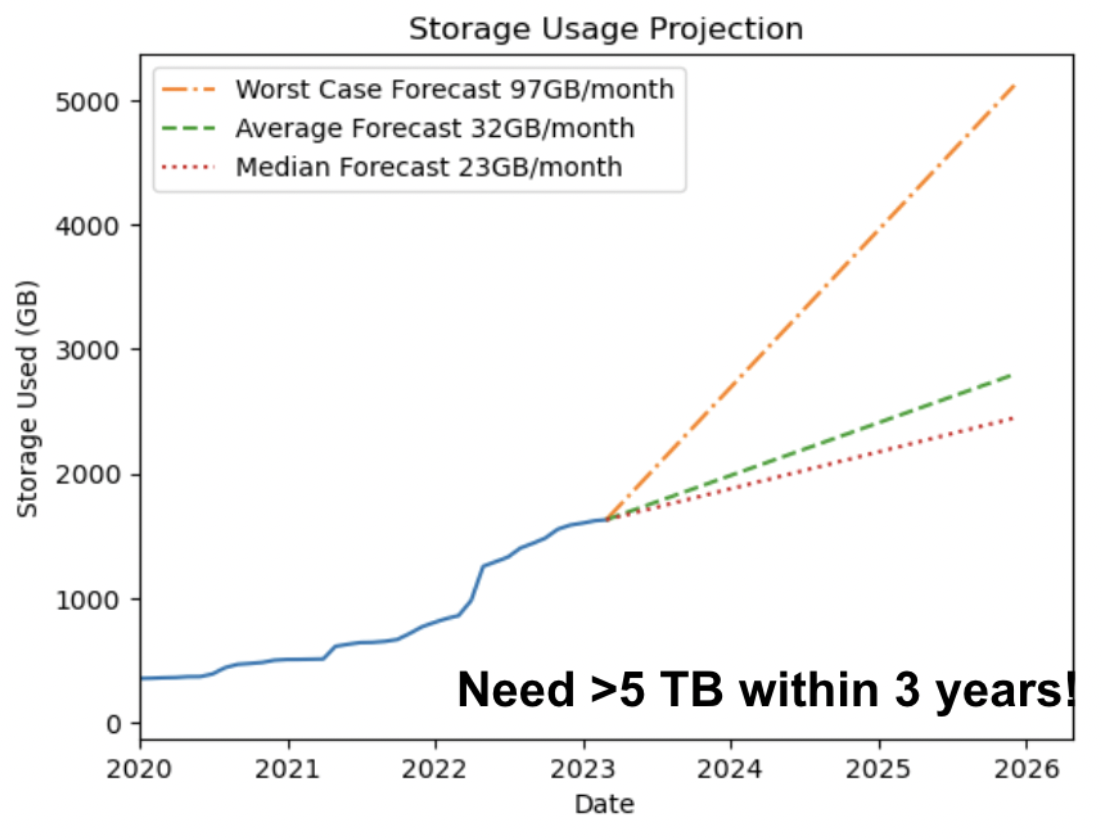
- Cost of storage increases with volume of data, making data storage critical (Figure 2).
- The data associated with one sample's manufacturing process is unstructured and varies batch to batch.
data description
Currently, a lab member will run a Jupyter Notebook to start manufacturing a batch of cells with PASCAL, which is currently (previous batches were handled differently) configured to output two folders:
1) containing a JSON worklist of a chain of steps that each cell sample undergoes, and
2) containing characterization outputs (measurements on metrics that indicate the quality of a cell) and details of the step that captured that metric in another JSON.
Current metrics from the characterization step are:
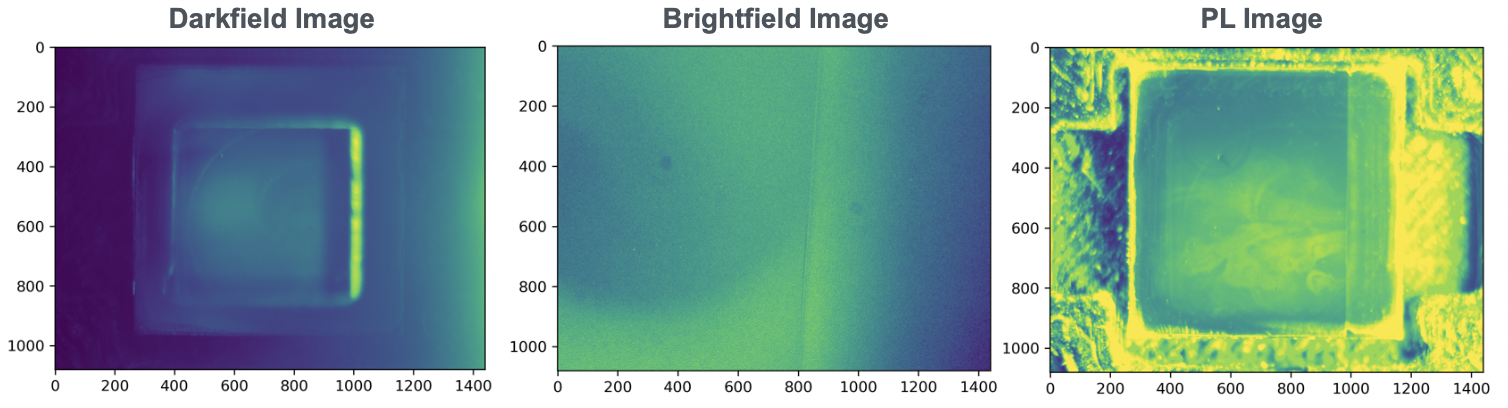
- PL image (Figure 3)
- Brightfield image (Figure 3)
- Darkfield image (Figure 3)
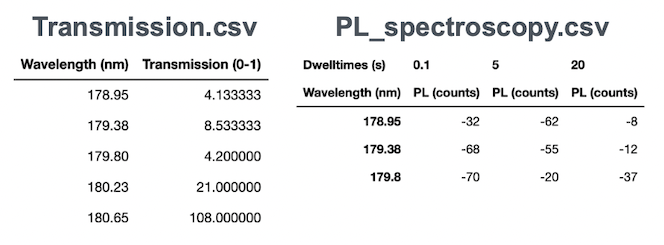
- Visible light transmission spectroscopy (Figure 4)
- PL spectroscopy (Figure 4)
Each sample will have one of each. Images are 1080x1440 each, and CSVs range up to several thousand rows.
prior/existing database solutions
Out of the existing perovskite cell databases we found that only one, The Perovskite Database, attempted to store manufacturing data; the rest were primarily concerned with chemical compositions, or broader research in general. The database, however, being open source, did not address most of the core requirements we identified above.
methods
Our final product involves a database and data pipeline.
choosing a database
We built and tested 3 databases:
1) A single tabular database (modeled after an existing, private solution we heard from a lab member)
2) A tabular, relational database ("RDB")
3) A Neo4j graph database
Tabular Databases
Database 1 involved storing entire JSON worklists for each sample into columns in a single table, which can be queried via some versions of SQL.
Database 2 involved a fully fledged (PostgreSQL) relational database.
While simple, there are drawbacks:
- Lots of duplicate data and empty cells due to varying numbers of manufacturing steps per sample - e.g. some cells had an anti-solvent and some don't; this column has substantial empty entries.
- Fixed tables are not the most flexible - e.g. if a new step were to be added, the database schema would have to be updated and all the data reinstantiated
- (For the RDB) To have all tables meet the properties of a valid RDB, the data had to be split a lot (Figure 5).
This means poor query runtime, since all tables have to be joined (O(nᵈ) for d tables) every query.
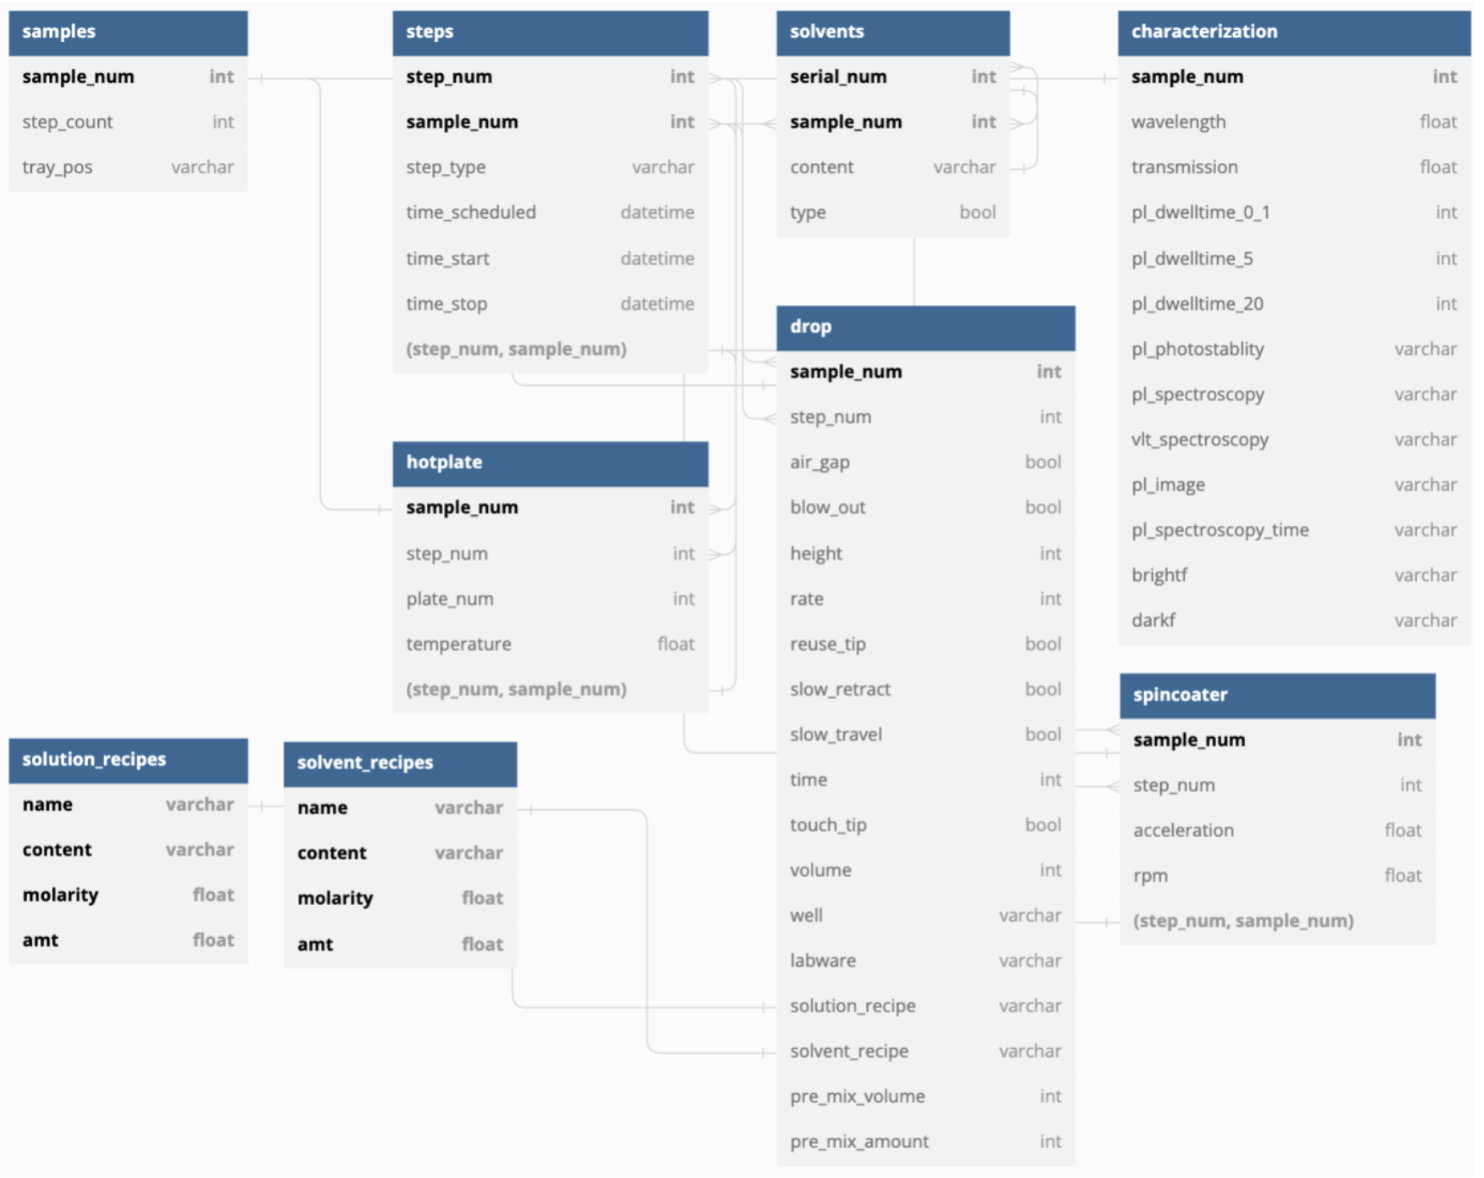 There are nine tables; our implementation was able to only use six.
Graph Databases
We began by meeting an original SOLEIL member, Rishi Kumar, who built a prototype of a graph database solution using MongoDB, by using documents as nodes and using pointers to define relationships. There were several limits to this solution, notably the filesize limit on each document; storing large images seemed unfeasible.
That said, Kumar's expertise with perovskite solar cell manufacturing made his approach to storing a cell's worklist very intuitive. Initially we considered linking chemical nodes with action relationships, but Kumar indicated that past a certain point, the chemicals undergo a string of actions, and it is more improtant to record the properties of those actions rather than the state of the chemicals. The "Results" section contains a visual representation of a worklist.
We committed to Neo4j, which boasts that it "outshines relational databases in query performance by orders of magnitude" due to a "native graph database" and its "graph-optimized query language", Cypher. Our final product involves a Neo4j graph database and a data import pipeline.
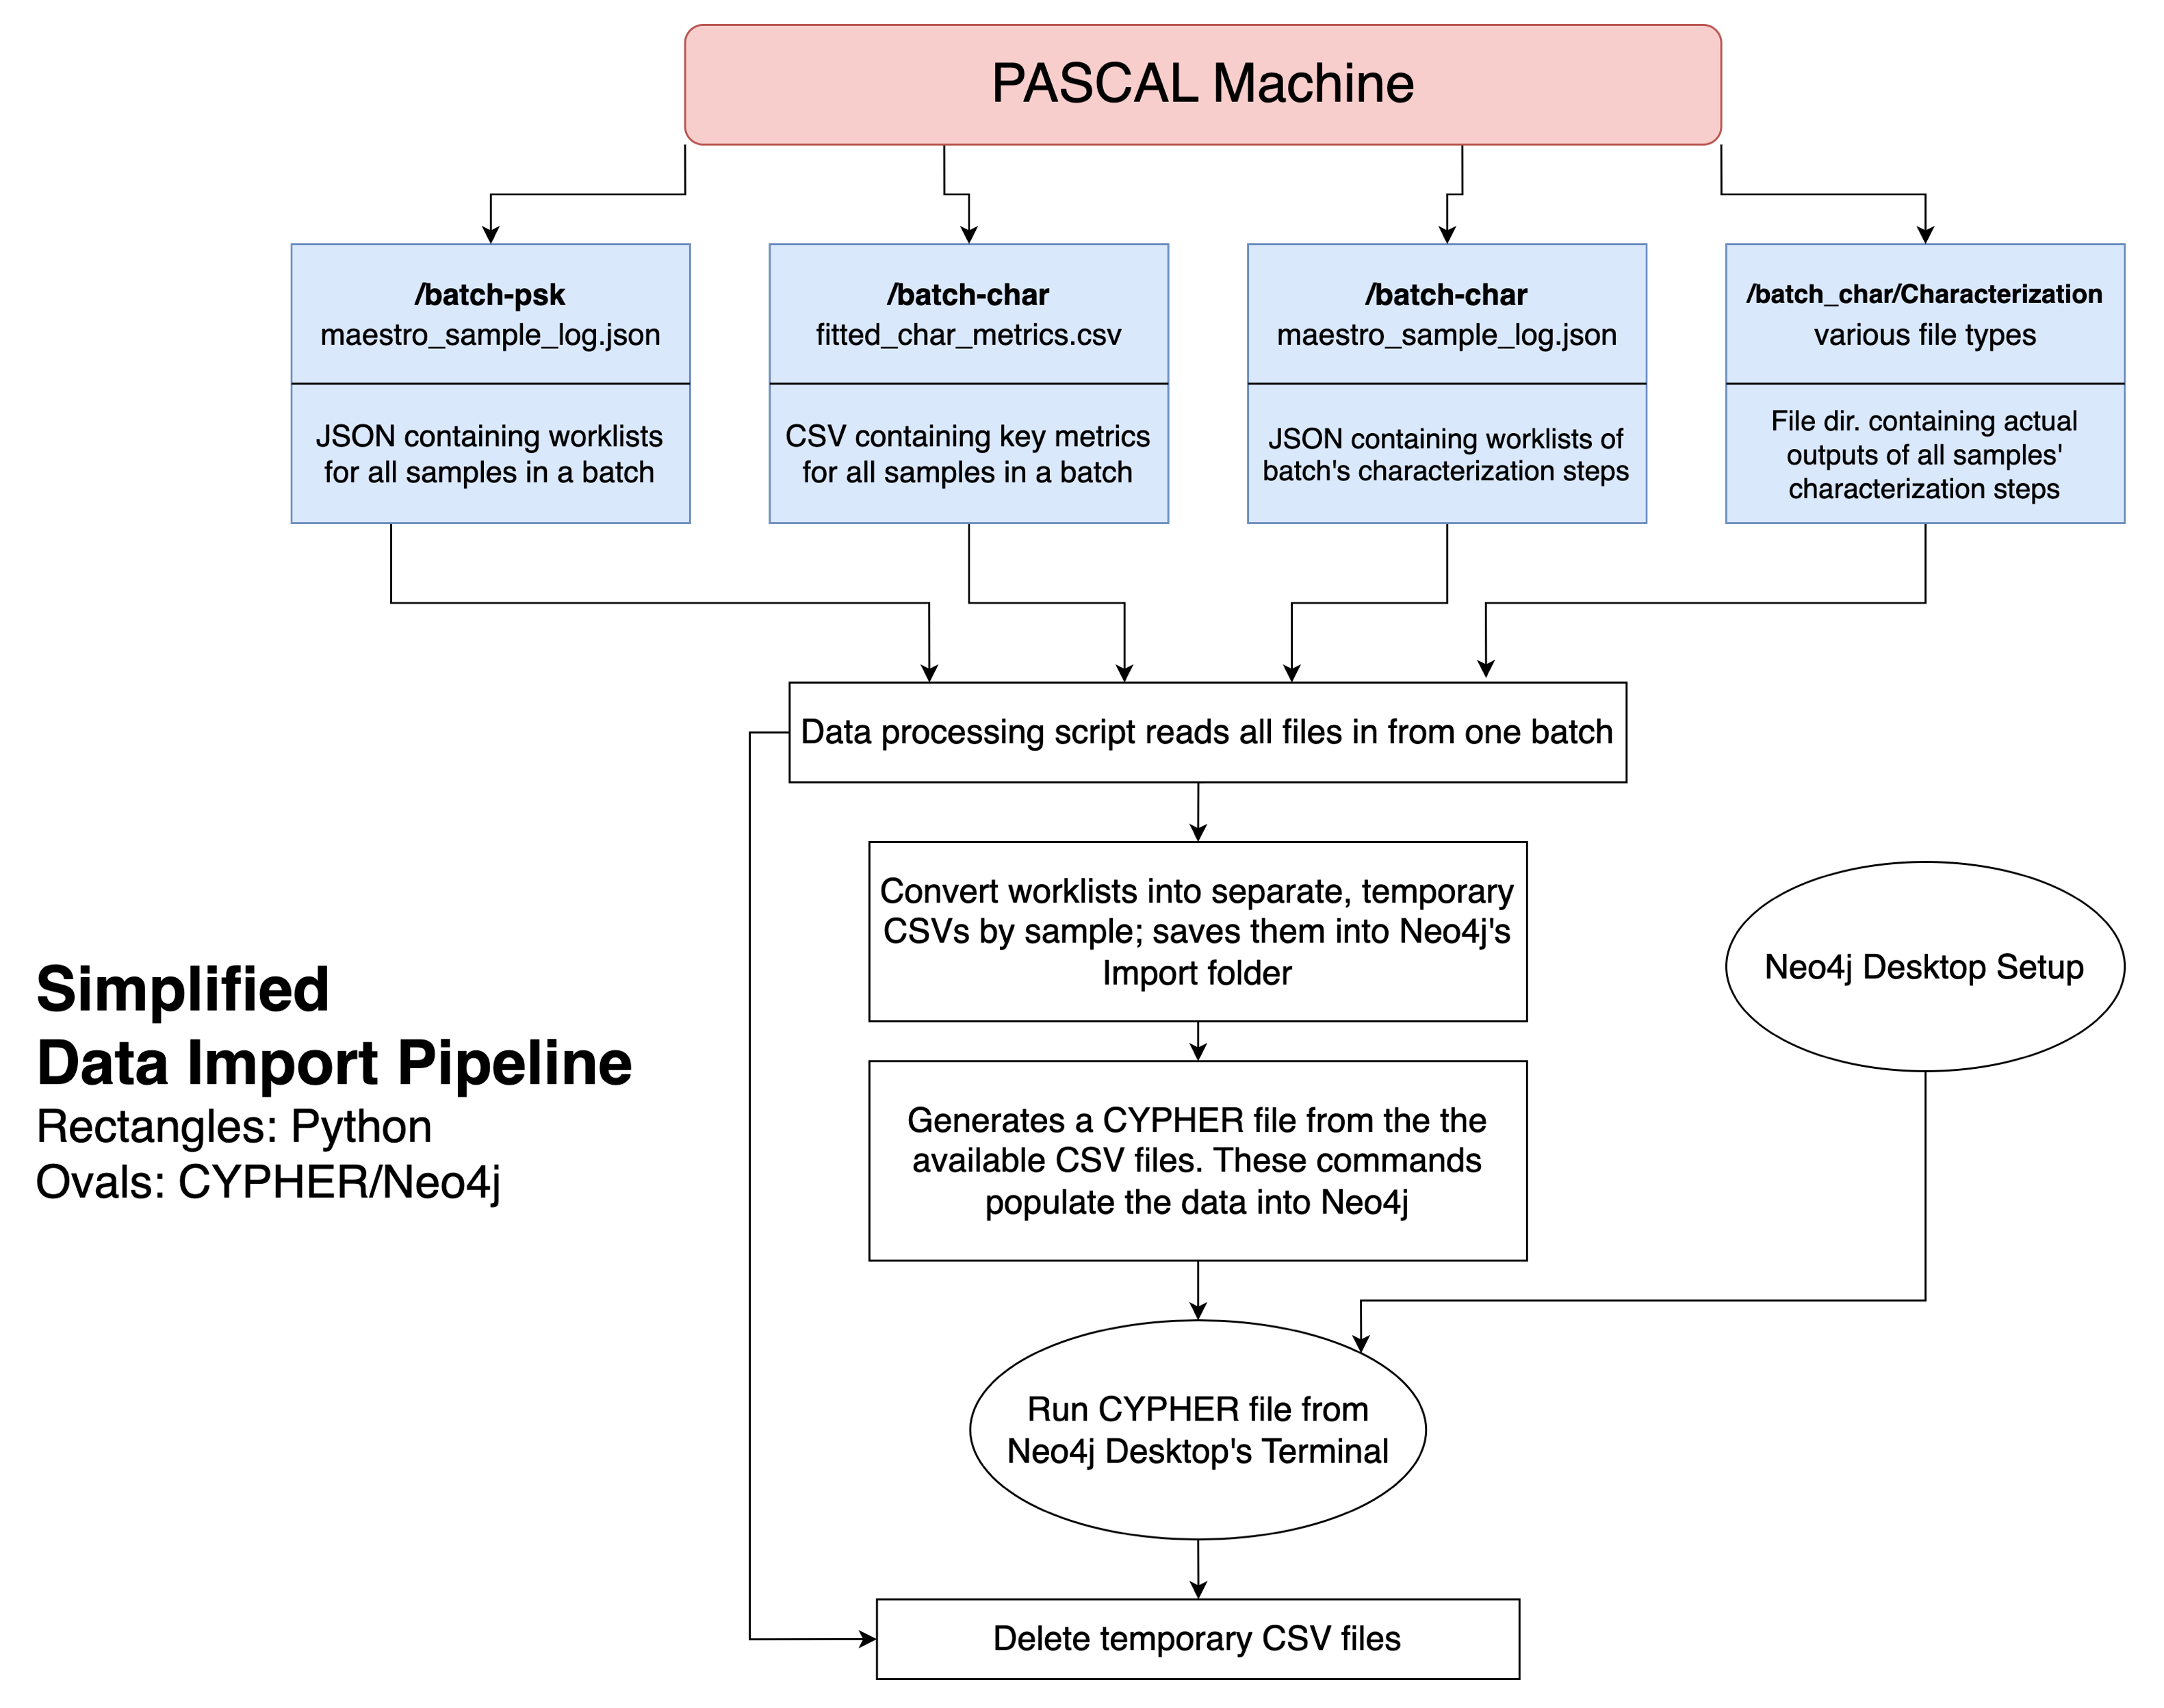
data pipeline
We built a data import pipeline in Python to take PASCAL’s raw output across multiple folders, clean and consolidate the data, and update the graph DB (Figure 6). This pipeline is backwards compatible and minimizes switching costs for the lab, which executes most of their code through Jupyter Notebooks.
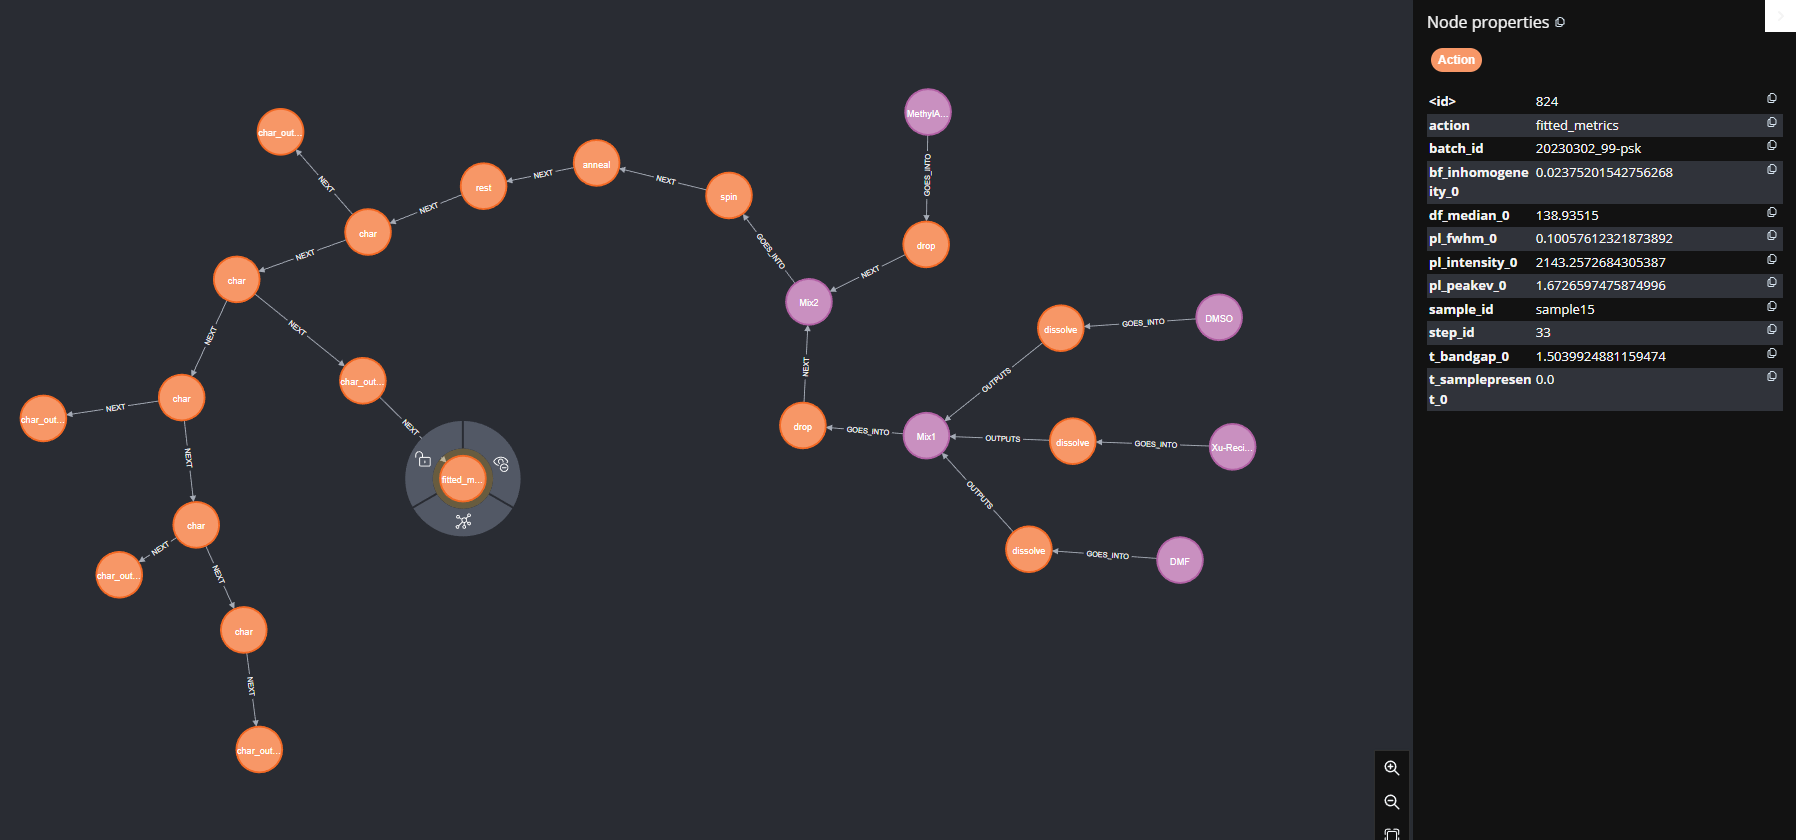
results
Figure 7 below is an example of one solar cell sample's worklist, and some of the properties in the summary metrics node. The worklists starts with the chemicals on the right, and proceeds according to the direction of the arrows.
performance
Runtime
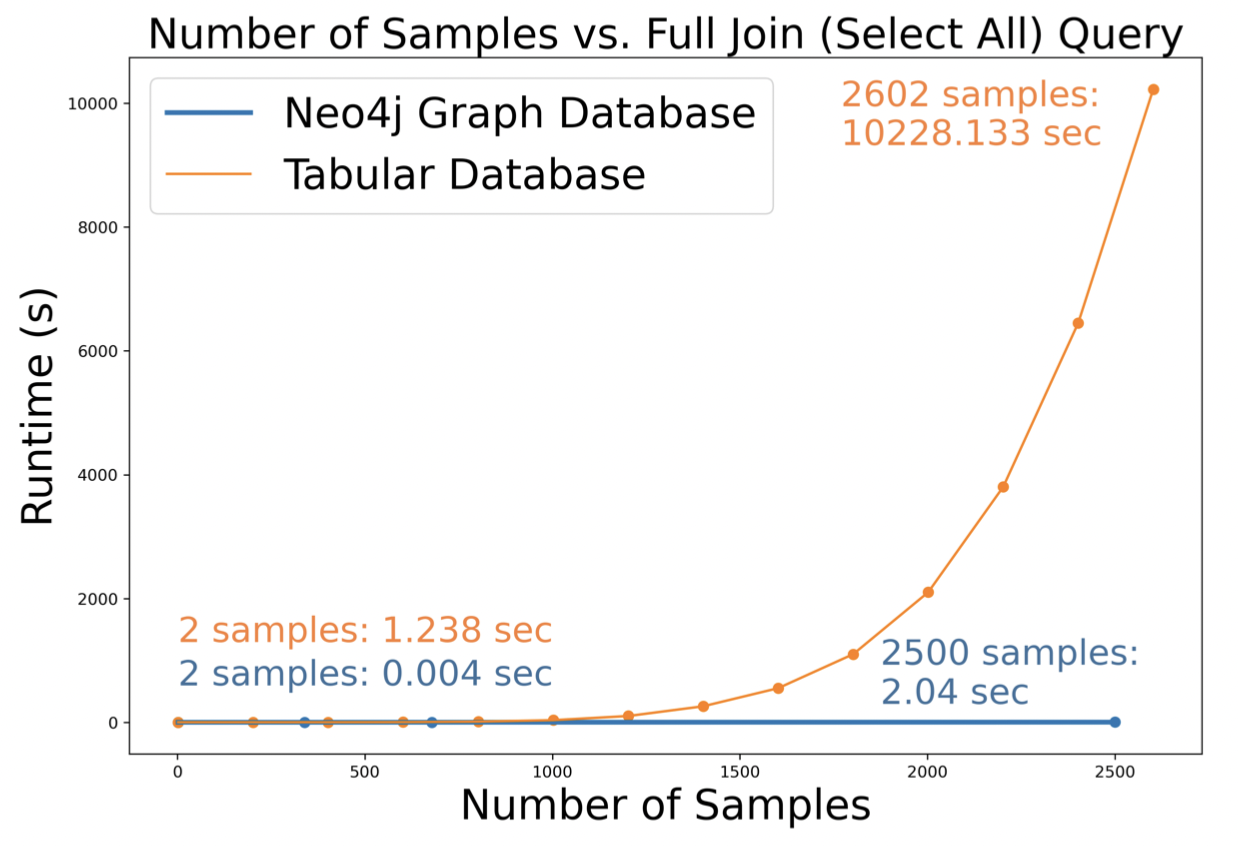
The figures below compare the query runtime of our graph database and RDB.
- Figure 8 shows that on a full database query, the graph DB (O(n)) outperforms the RDB (O(n⁶), since our solution has six tables).
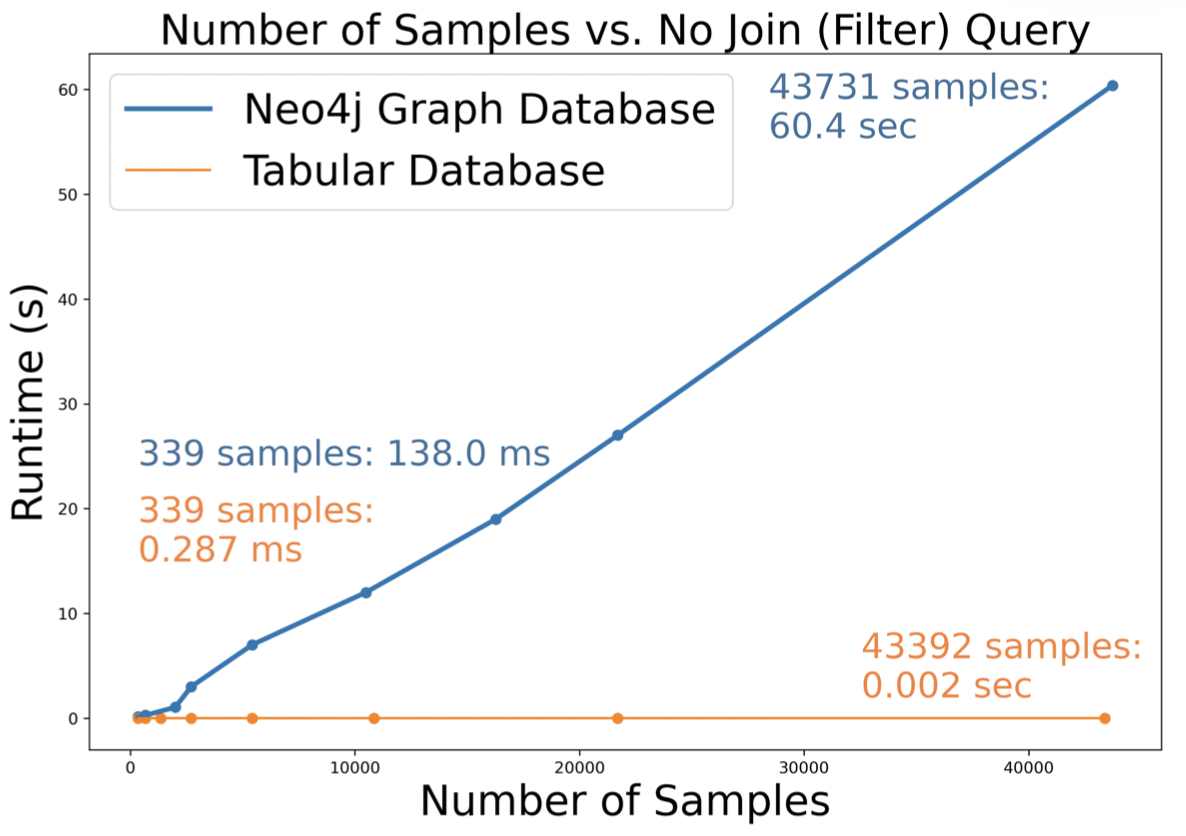
- Figure 9 shows that on a query that requires no joins, the RDB (O(1)) outperforms the RDB (O(n)). In practice, however, queries that have no joins will almost never be used.
Memory
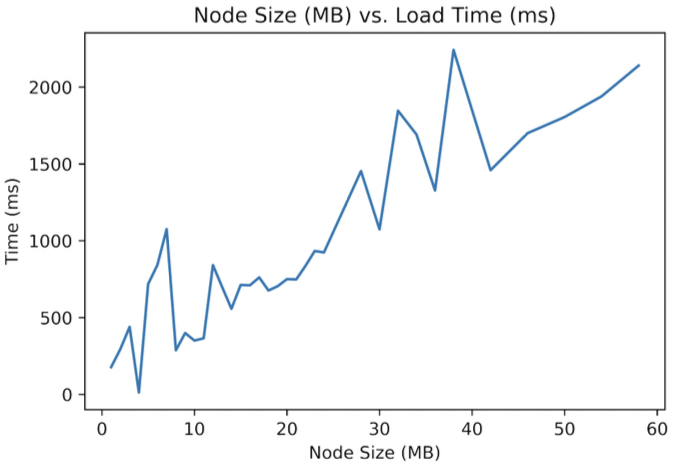
Neo4j has documentation on its maximum database size, node size limits, etc., but we were able to surpass them in our empirical tests. Functionally, we found Neo4j fails when asked to construct the relationships of 100,000 samples in one query (something never done in practice; samples are manufactured and in batches of ~40). Figure 10 shows how runtime increases as the data filesize increases on a single node.
We also found that many of these memory limits (maximum single CSV import filesize, for example) can be increased via changing the default limit in a config file. On further research we found that import limits may even be system dependent.
limitations and future work
Beyond runtime and memory constraints imposed by Neo4j:
- Hosting: We used Neo4j Desktop. While sufficient, we were unable to find a way to expose the database to the web within the free/communty edition tier. The database is hosted on a lab computer that can be remotely accessed. Though we are able to connect to the database and run Cypher queries via a Jupyter Notebook, lab members will still have to remote access the computer.
- Implement a data export pipeline that takes data directly into analysis/machine learning, for example. We did not get to this as the novelty of migrating to a graph database meant the lab was still unsure of what output or tools would be most useful to them.
- Add extra features into the DB, like nominal data.
acknowledgements
Special thanks to:
- Prof. David Fenning, and SOLEIL members Deniz Cakan and KC Wong for resources and guidance throughout the project. Wong also provided Figures 1 and 2.
- Rishi Kumar for data strategy guidance.